Welcome to the comprehensive guide on installing Grafana Loki Stack using AWS S3. In this tutorial, we’ll walk you through the step-by-step process of setting up the powerful Grafana Loki log aggregation system in conjunction with Amazon S3 storage. By the end of this guide, you’ll have a solid understanding of the installation procedure, allowing you to effectively manage and visualize your logs. Let’s dive in!
Prerequisites
Before we start, ensure you have the following prerequisites in place:
- AWS Account: You need an active AWS account with necessary permissions to create S3 buckets and access AWS services;
- Grafana Knowledge: A basic understanding of Grafana, its components, and its role in data visualization;
- Command Line Interface: Familiarity with the command line interface to execute commands.
Step 1: Setting Up an AWS S3 Bucket
To begin, we’ll create an S3 bucket to store the logs. Follow these steps:
- Log in to your AWS Management Console;
- Navigate to the S3 service;
- Click “Create Bucket” and provide a unique name and desired region;
- Configure the bucket settings, including permissions and encryption;
- Click “Create Bucket” to finalize.
Step 2: Installing Loki Stack
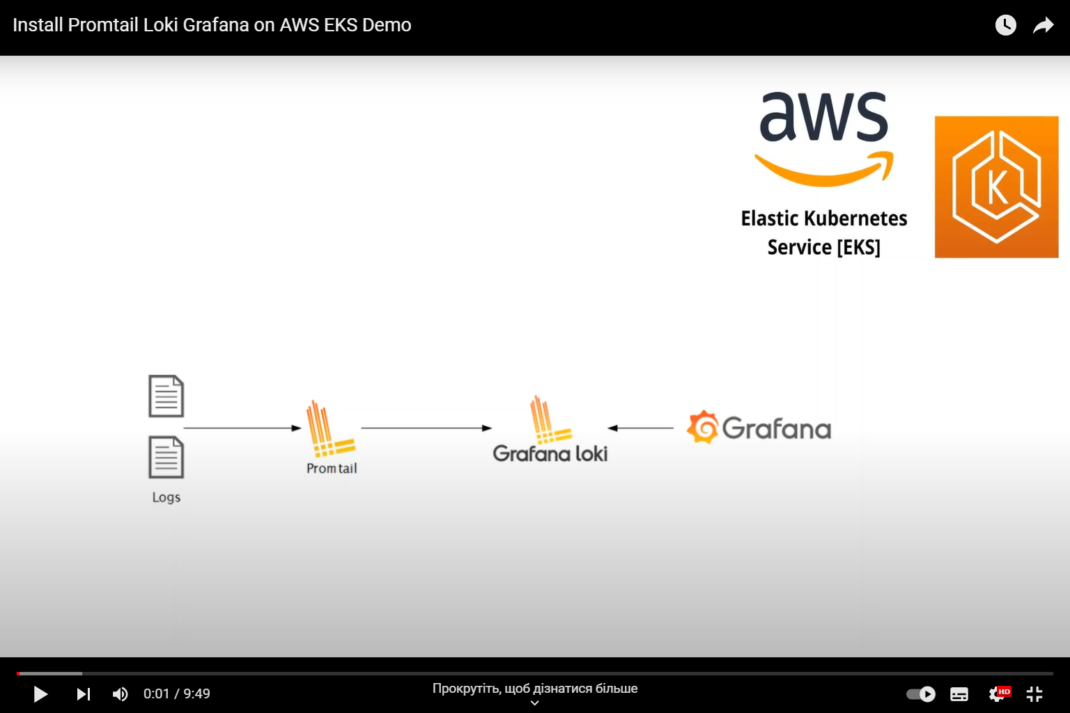
In this section, we’ll install the Loki Stack components, including Loki, Promtail, and Grafana.
2.1 Installing Loki
Loki is the heart of the stack, responsible for collecting and storing logs efficiently. Execute the following commands:
2.2 Installing Promtail
Promtail is the log shipper that sends logs to Loki. Run the following commands:
Step 3: Configuring Loki and Promtail
Now, let’s configure Loki and Promtail to work together effectively.
3.1 Loki Configuration
Edit the Loki configuration file to define the S3 storage.
3.2 Promtail Configuration
Adjust the Promtail configuration to match your log sources and Loki instance.
Step 4: Integrating with Grafana
Grafana is where the magic happens – visualizing your logs. Let’s integrate it with Loki:
- Access your Grafana instance;
- Go to “Configuration” > “Data Sources.”;
- Click “Add Data Source,” choose “Loki,” and provide the Loki URL;
- Save the configuration.
Step 5: Creating Visualizations
With Loki and Grafana set up, it’s time to create visualizations for your logs.
- In Grafana, go to the dashboard;
- Click “Create” > “Dashboard.”;
- Add a new panel and select the Loki data source;
- Customize the visualization using queries, graphs, and labels.
Step 6: Creating Log Labels and Filters
Loki allows you to add labels to your logs, making it easier to filter and categorize them. Here’s how to do it:
- Open your Loki configuration file;
- Under “clients”, add the following block to define a label stage;
- Restart your Loki instance.
Now, your logs will have a “job” label, helping you filter logs based on their source.
Step 7: Scaling and High Availability
As your log volume grows, you might need to scale your Loki setup. Consider these steps for scaling and ensuring high availability:
- Distribute Loki: Deploy Loki components across multiple servers or instances;
- Load Balancing: Use a load balancer to evenly distribute traffic among Loki instances;
- Replication: Implement replication to ensure redundancy and failover.
Remember, scaling and high availability strategies vary based on your infrastructure and requirements.
Step 8: Querying and Analysis Tips
Loki’s power lies in its query capabilities. Here are some advanced querying tips to extract meaningful insights from your logs:
- Log Aggregation: Group logs by labels or specific attributes for aggregated views;
- Regex Filters: Use regular expressions to filter logs based on patterns or keywords;
- Temporal Analysis: Analyze logs over time to identify trends and anomalies;
- Visualization: Combine Loki with Grafana to create compelling visualizations for better data interpretation.
Step 9: Maintenance and Best Practices
Maintaining your Loki Stack ensures consistent performance and security. Follow these best practices:
- Regular Updates: Keep Loki and its components up to date to benefit from the latest features and bug fixes;
- Backup and Recovery: Regularly back up your Loki configurations and data to ensure recovery in case of failures;
- Monitoring and Alerts: Set up monitoring to track the health of your Loki Stack and receive alerts for anomalies;
- Optimize Storage: Periodically optimize your storage solutions for cost-effectiveness and performance.
Step 10: Integrating with Alerting Systems
Setting up alerts based on log data is crucial for proactive issue resolution. Here’s how to integrate Loki with alerting systems:
- Configure Alerts: Define alerting rules in Loki to identify specific log patterns or anomalies;
- Alertmanager Integration: Integrate Loki with Prometheus Alertmanager to manage and route alerts;
- Create Alerting Channels: Set up notification channels (email, Slack, etc.) to receive alerts;
- Test and Refine: Regularly test alerts to ensure they trigger appropriately and refine rules based on feedback.
Step 11: Security Considerations
Securing your Grafana Loki Stack is essential to protect sensitive log data. Follow these security practices:
- Access Control: Implement IAM roles and permissions to restrict access to your S3 bucket and Loki components;
- Transport Encryption: Enable SSL/TLS to encrypt communication between components;
- Authentication: Utilize authentication mechanisms (like AWS IAM or Loki’s built-in auth) to verify user identities;
- Audit Logging: Enable audit logs to track activities and potential security breaches.
Step 12: Performance Optimization
As your log volume grows, optimizing performance becomes vital. Consider these strategies:
- Indexing: Utilize Loki’s indexing options to enhance query performance;
- Retention Policies: Set appropriate retention policies to manage storage costs and performance;
- Query Planning: Optimize queries by understanding how Loki processes data and executes queries;
- Resource Allocation: Properly allocate resources to Loki and related components for efficient operation.
Step 13: Real-World Use Cases
Explore how the Grafana Loki Stack can benefit various scenarios:
- Application Monitoring: Monitor application logs to identify performance bottlenecks and user experience issues;
- Security Analysis: Detect security breaches by analyzing logs for suspicious activities and patterns;
- Infrastructure Monitoring: Monitor server and network logs to ensure infrastructure stability;
- Business Insights: Extract business insights from logs to make informed decisions and optimizations.
Conclusion
Congratulations! You’ve successfully installed the Grafana Loki Stack using AWS S3. This powerful combination allows you to efficiently manage and analyze your logs, enabling better insights and troubleshooting.
FAQs
Yes, while this guide focuses on AWS S3, Loki supports various storage backends.
Absolutely! Loki’s flexibility makes it suitable for applications of all sizes.
Ensure proper IAM permissions and encryption settings to enhance security.
Yes, Grafana allows you to consolidate logs from various sources into a single dashboard.
Utilize index structures and optimize query patterns to enhance log retrieval speed.